Analytics & Insights
Ten dashboards, filters you can share, drill-down to the records, and exports.
In this guide, and all guides
The dashboards
- In the app
- Analytics & Insights, then Executive Overview
- Who
- Super Admin
- Payroll Manager
- Accountant
- HR Manager
- Department Manager
- Auditor
Ten pages: Executive Overview, Workforce, Payroll, Attendance, Leave, Recruitment, Performance, Tax & Compliance, Financial and Custom Reports. Tabs across the top move between them.
- Every figure is computed on the server from the same records the rest of Plutus holds. Payroll figures use locked runs only.
- The (i) beside a figure shows its definition.
- A period with no records shows no figure, rather than zero.
- Each role sees the sections its access allows. Department Managers see only their departments.
 (opens full size in a new tab)
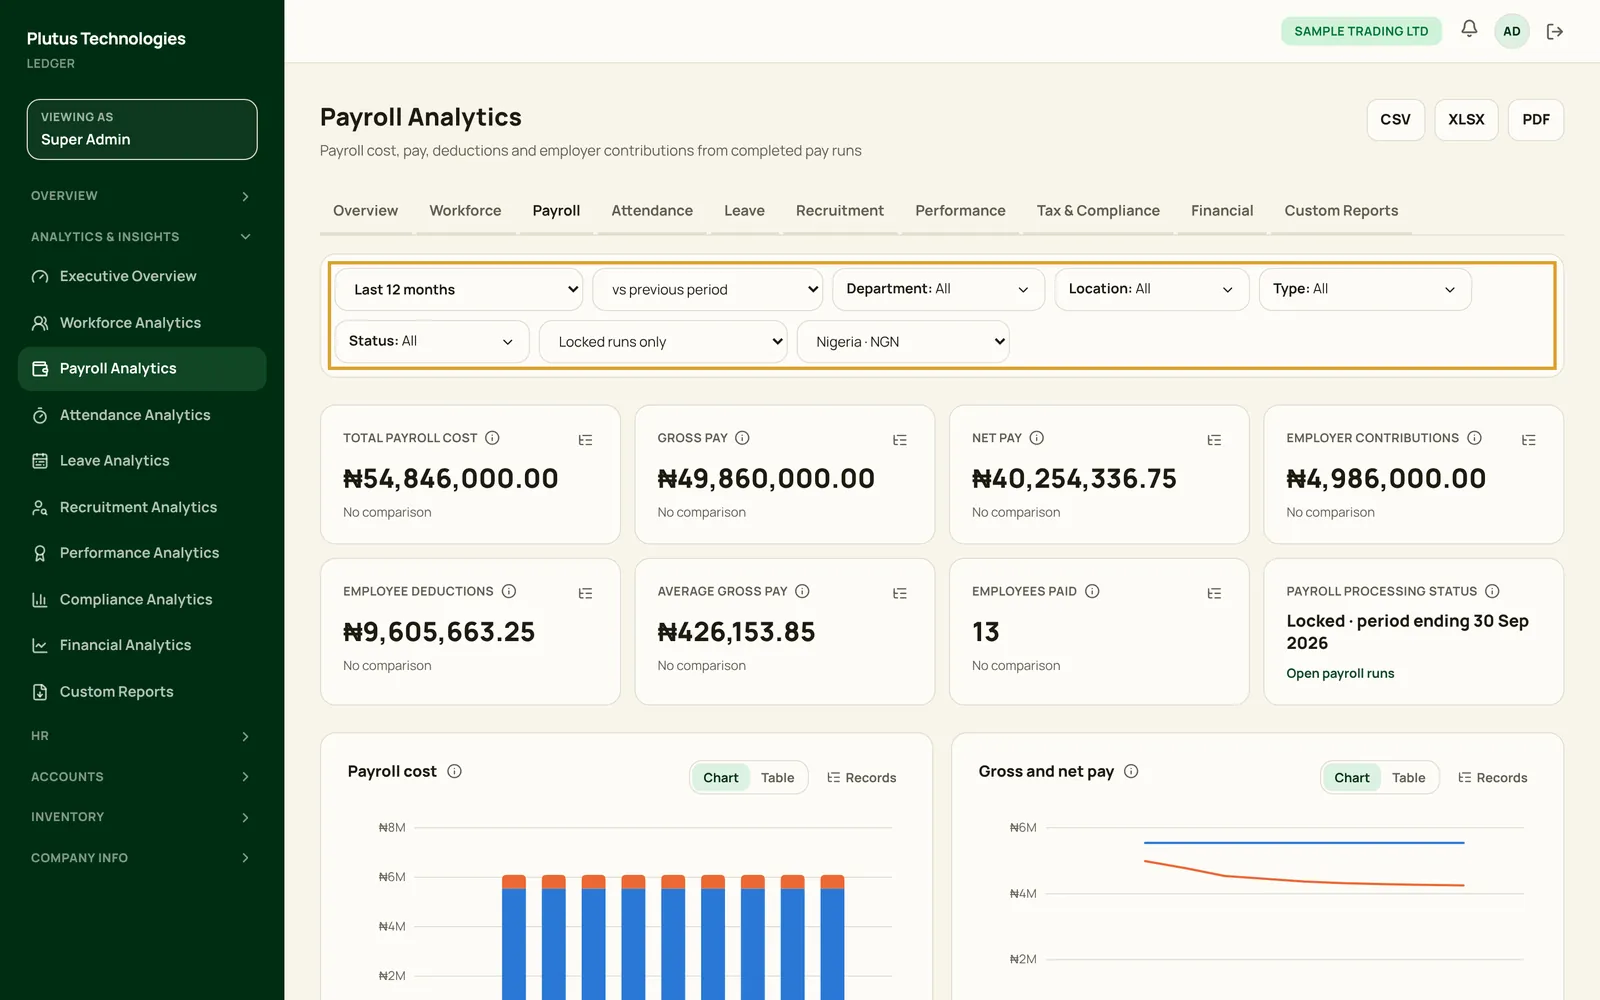
Filter and share a view
- Choose the period, and what to compare it with: the previous period or the same period last year.
- Narrow it by department, location, employment type, status, payroll status or country.
- Copy the address to share the view. Filters are kept in the address, and they carry across the tabs.
Drill down to the records
- On any chart, switch between Chart and Table.
- Choose Records to open the rows behind a figure.
- Use CSV, XLSX or PDF at the top of the page to export the section.
Custom reports
- In the app
- Analytics & Insights, then Custom Reports
- Who
- Super Admin
- Payroll Manager
- Accountant
- HR Manager
- Auditor
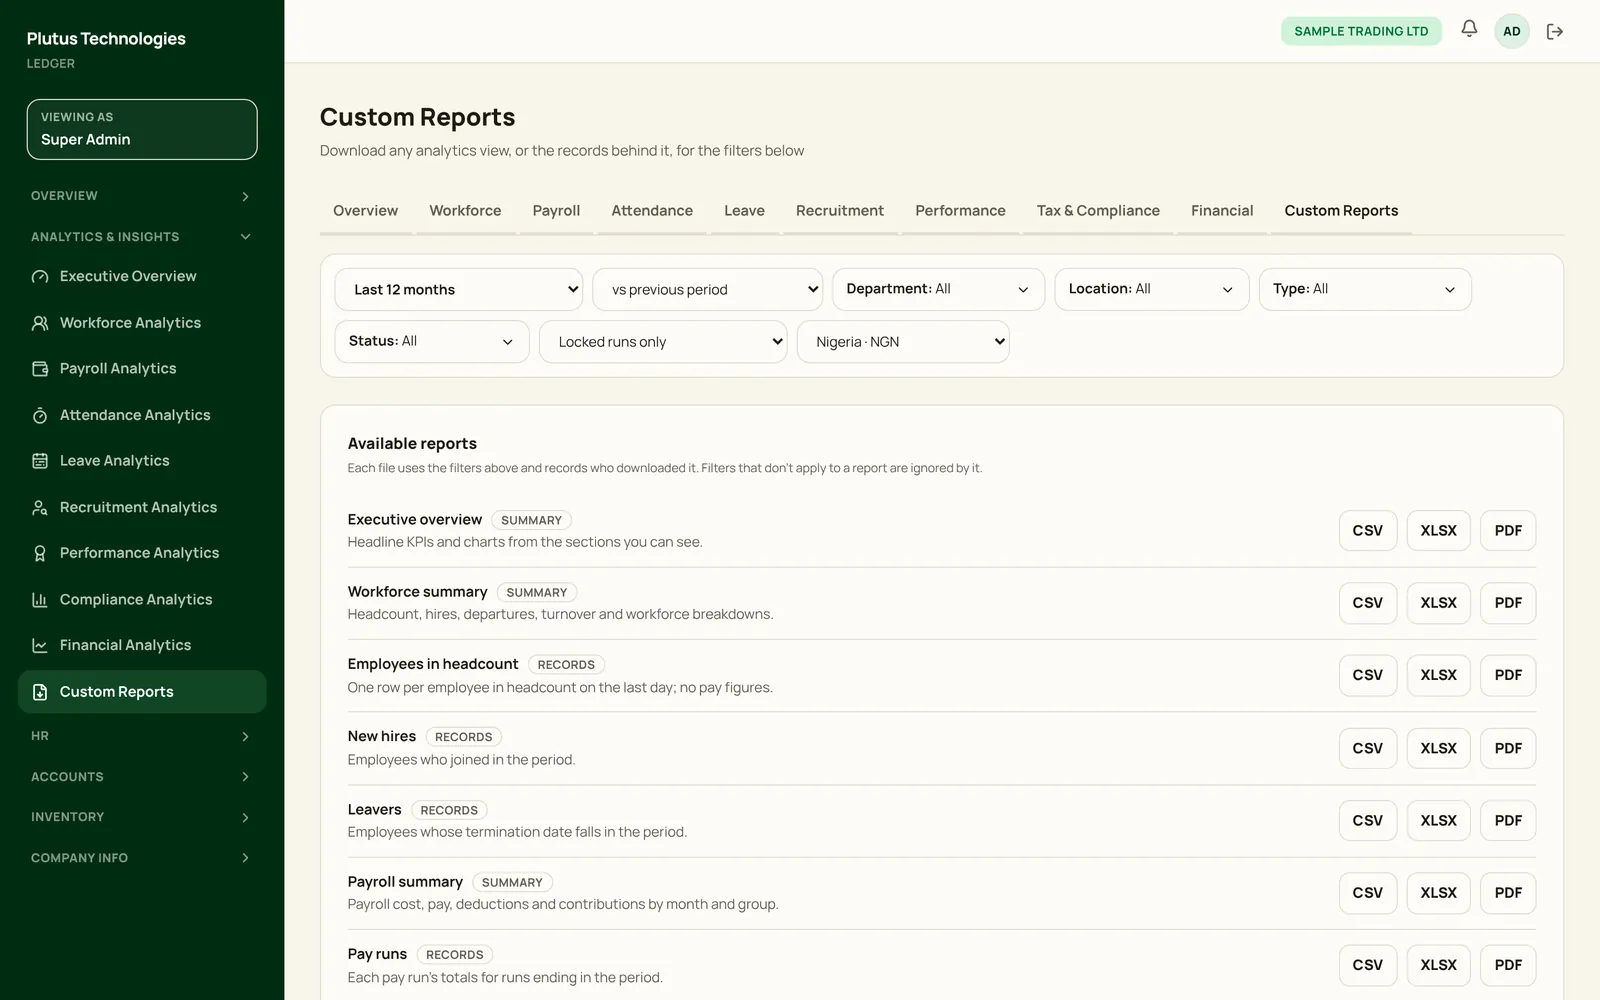
Download any dashboard, or the records behind it, as CSV, XLSX or PDF. Each file uses the filters you set, and Plutus records who downloaded it.
 (opens full size in a new tab)